Charts and Dashboards | FusionCharts
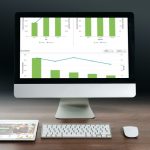
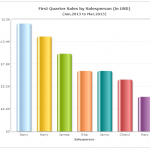
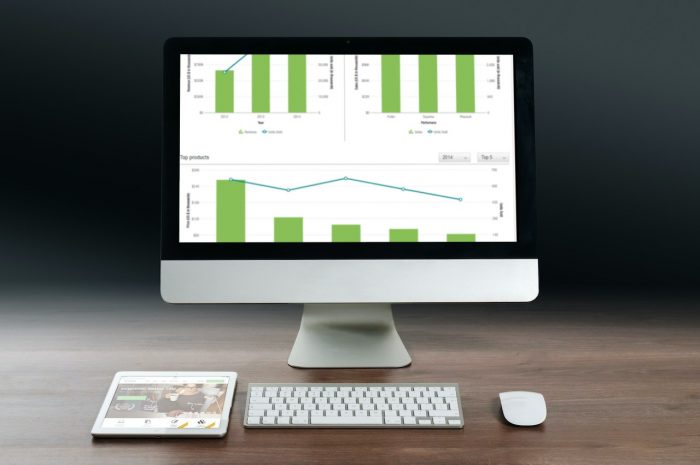
Charts and dashboards are powerful tools used in data visualization and business intelligence to present information in a visual format. They help simplify complex data sets and make it easier for users to understand and analyze data trends, patterns, and insights.