• $00
Tutorial: Creating a Real-Time Bitcoin Ticker in JavaScript
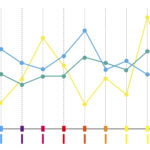
The three leading KPIs showcase real-time values of top cryptocurrencies like Bitcoin, Litecoin, and Ethereum. This live bitcoin chart below the KPIs demonstrates a Bitcoin Ticker where the variation in bitcoin prices is captured. The x-axis denotes the timestamp variation, and the y-axis indicates bitcoin prices in dollars. You can find a collection of great CSS tools and resources at html-css-js.com: code beautifier, cheat sheet, style generators, useful links, etc.